Sometimes you need to have multiple time widgets in a single Splunk dashboard, the scenario I encountered was for a global SOC operation. The solution provided here handles displaying local time using just a timezone parameter. As a bonus; it automatically handles daylight time savings too :-)
The solution consists of two components; a report that creates the timestamp string and a dashboard component displaying the timestamp. All code is available as a ready to use Splunk app which you can find in my Splunk Content Library repository on Github.
Report
The report is provided as savedsearch named SX001 - Get datetime by timezone in the aforementioned Splunk app. This report takes a parameter called TZ which should contain a timezone string as used in the zoneinfo database, you can check the following Wikipedia page for possible values or consult the /usr/share/zoneinfo directory on your system.
| makeresults
| eval Time=now()
| eval DateFormatString="%Y-%m-%d  %H:%M"
| eval TargetTimezoneID="$TZ$"
| eval TargetTimeDisplay=strftime(2*Time-strptime(strftime(Time, DateFormatString." ".TargetTimezoneID), DateFormatString." %Z"), DateFormatString)
| fields TargetTimeDisplay
| table TargetTimeDisplay
You can adjust the DateFormatString to your liking, but in any global setting I would recommend this format.
Dashboard
The report should be called from using the savedsearch command and the parameter TZ containing the timezone string should be provided, for example:
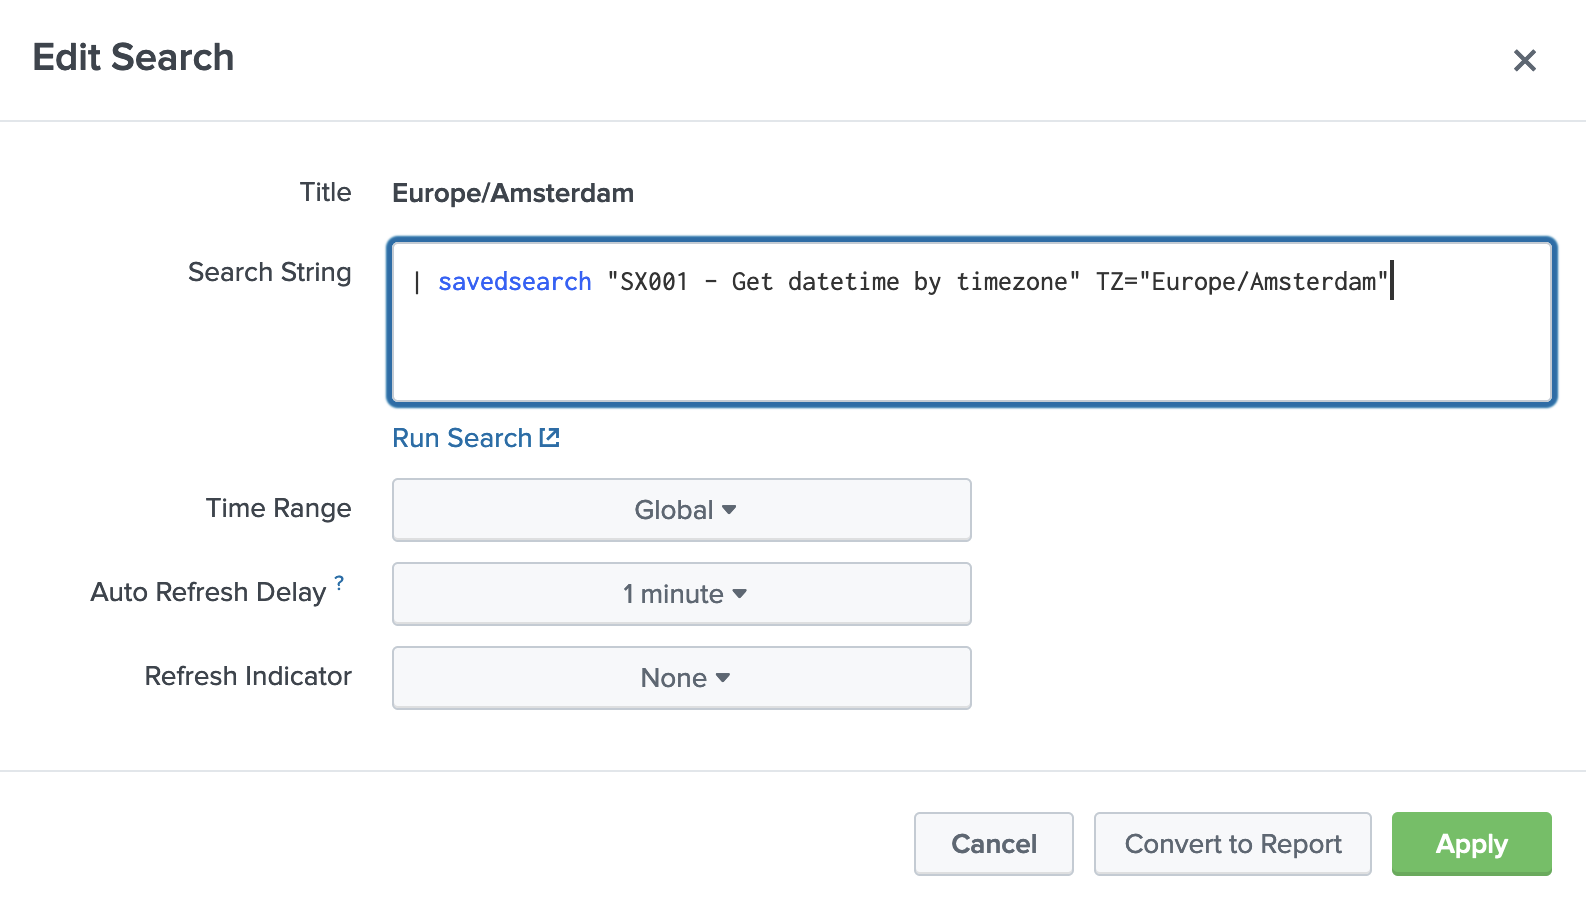
| savedsearch "SX001 - Get datetime by timezone" TZ="Europe/Amsterdam"
When incorporating this into a dashboard panel I opted to use the Single Value dashboard widget and configured it like this:

You can now simply add multiple Single Value widgets, one for each timezone you have a presence in, onto your dashboard to get someting similar to this:

Pretty simple, no?
I will be adding more examples to the Splunk Content Library soon (TM)