I needed to on-board the Linux system logs of all my homelab systems into Splunk. Apparantly I haven’t been paying attention… but only now I noticed that in EL8 (CentOS in my case) rsyslog is not even installed by default. So that prompted me to finally take a closer look into journald, this resulted in a very simple Splunk TA that can be deployed to any Splunk instance to ingest the journald logs.
What is described here is geared towards environments where the Splunk UF is installed on Linux endpoints.
Pulling logs from the journal
As the logs in the journal are stored in binary format, extracting the logs is best suited for the journalctl command. As this needs to run repeatedly the easiest way to do this is to write a simple bash script. The implementation needs to have the following items covered:
- It needs to have very little overhead for the system
- It needs to maintain state as we don’t want to duplicate events in Splunk
- It needs to support some way of backfilling on first run (limited to todays logs)
- The logs should be easily parsable by Splunk (JSON)
So this is the script I came up with, please note that this requires the jq package to be installed.
#!/bin/bash

PATH=/bin:/usr/bin:/sbin:/usr/sbin
CUR_DIR=$(dirname $0)
STATE_DIR="${CUR_DIR}/../state"
STATE_FILE="${STATE_DIR}/journald.state"
STATE_LOGFILE="${STATE_DIR}/journald.log"

update_state () {
	if [ -s ${STATE_LOGFILE} ]; then
		# only update state if we have a new one
		STATE=$(tail -n1 ${STATE_LOGFILE} | jq -j '.__CURSOR')
		echo -n ${STATE} > ${STATE_FILE}
	fi
}

if [ -s ${STATE_FILE} ]; then
	# get state and logs
	CURSOR=$(cat ${STATE_FILE})
	journalctl --after-cursor="${CURSOR}" --no-tail --no-pager -o json | tee ${STATE_LOGFILE}
	update_state
fi

if ! [ -f ${STATE_FILE} ]; then
	# no state (first run?); get logs of today
	journalctl --no-tail --since today --no-pager -o json | tee ${STATE_LOGFILE}
	update_state
fi
Inputs configuration
To get that scripted input configuration going I saved the shell script as get-journald-logs.sh and placed that in a directory called bin which is in the TA root directory. The script needs to be executable, so lets make sure it is: chmod 750 get-journald-logs.sh.
Now we need to actually define the scripted input configuration in inputs.conf. In my environment I’ve set the interval to 30 seconds, use the index linux to store the data and set the sourcetype to linux:journald; but I recommend you to adjust these settings to best suit your requirements and Splunk environment.
[script://./bin/get-journald-logs.sh]
interval = 30
sourcetype = linux:journald
disabled = False
index = linux
To have the fields extracted nicely a props.conf for the linux:journald sourcetype is required. If you changed the sourcetype name in inputs.conf make sure to match it here!
[linux:journald]
KV_MODE = json
NO_BINARY_CHECK = 1
SHOULD_LINEMERGE = false
TIME_FORMAT = %s
TIME_PREFIX = \"__REALTIME_TIMESTAMP\" : \"
pulldown_type = 1
TZ=UTC
Deploying the TA
Like stated earlier, this TA can be deployed to any Splunk instance. So make sure to drop it into deployment-apps, master-apps and shcluster/apps ;)
You can download the latest version of this TA from my Github
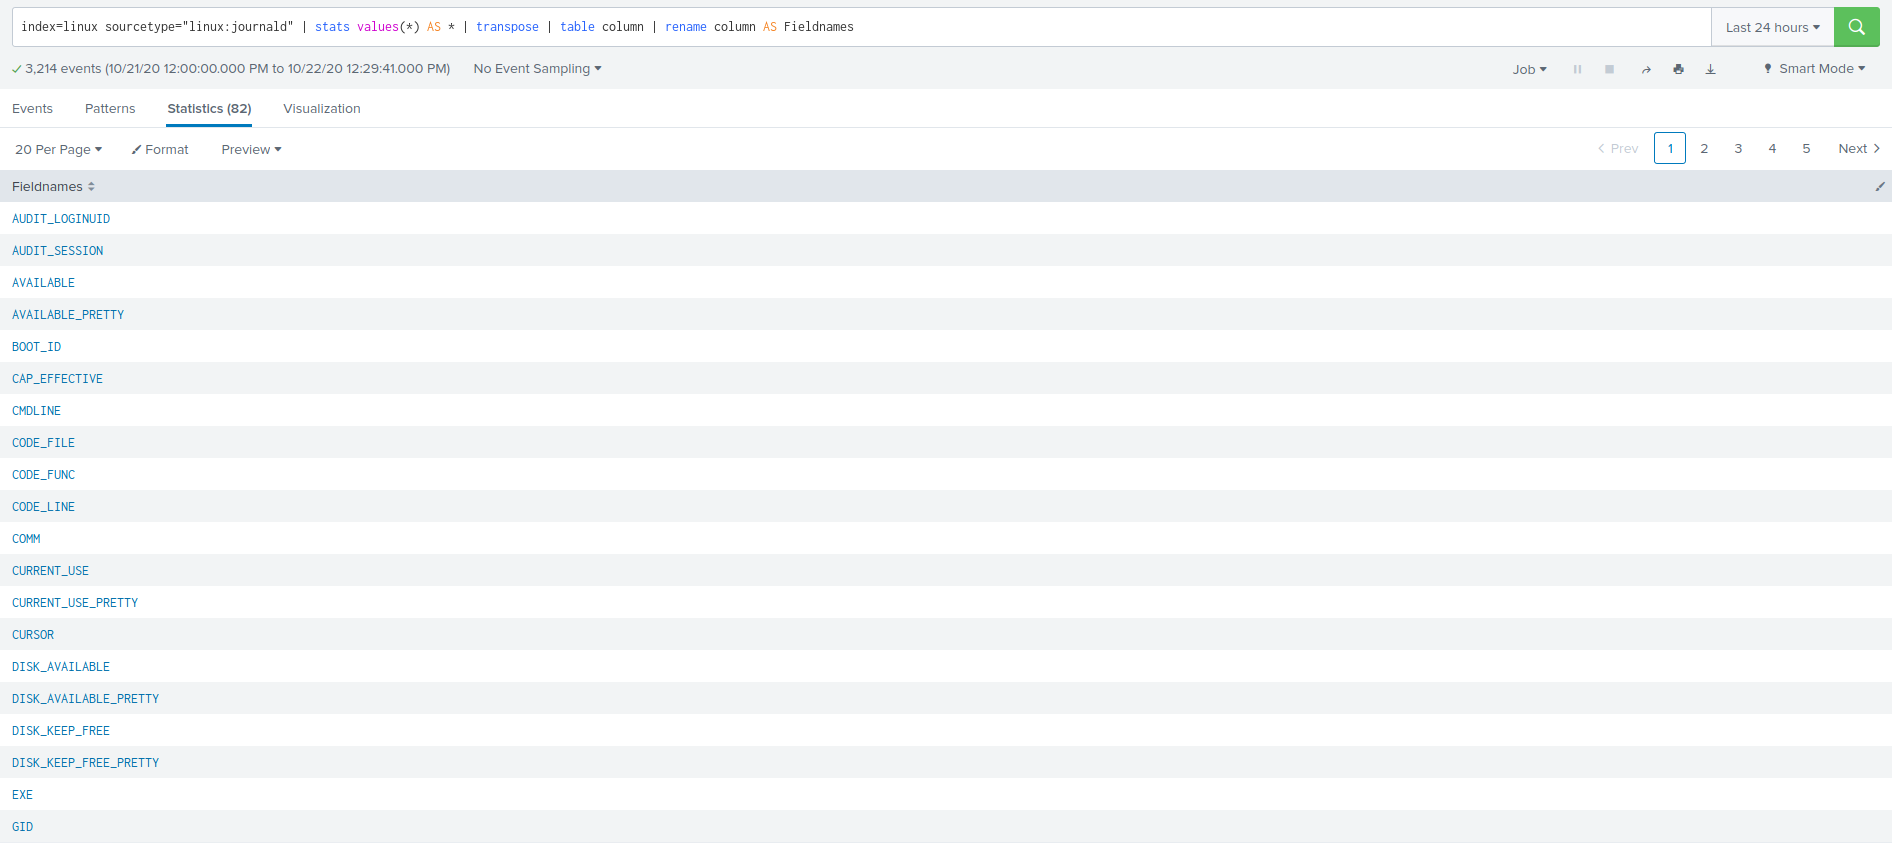
If everything worked as it should, the logs will provide a lot of fields to work with!
